User:Debra Tabron/sandbox
REMChlor-MD is a free toolkit available for download and is capable of simulating matrix diffusion in groundwater contaminant plumes. It is a significant upgrade from REMChlor 1.0[1], which does not include matrix diffusion in the plume. REMChlor-MD is useful for planning-level approximations of contamination extent and duration at sites where matrix diffusion is important. REMChlor-MD employes a semi-analytical method for simulating mass transfer between high and low permeability zones that provides computationally accurate predictions of concentration distributions and mass discharge in the higher permeability portions of an aquifer. Model run times for REMChlor-MD are much shorter than traditional fine grid numerical models.
Related Article(s):
CONTRIBUTOR(S): Dr. Ron Falta and Kien Pham
Key Resource(s):
Matrix Diffusion of Dissolved Contaminants
Groundwater contamination with dissolved contaminants, such as chlorinated volatile organic compounds (CVOCs), is pervasive at many current and former industrial sites globally.
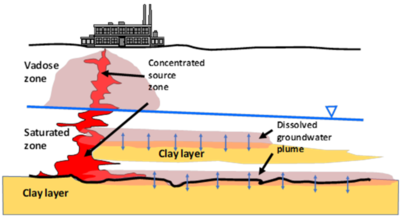
Plumes of CVOCs dissolved in groundwater often originate when the chemicals enter the subsurface as dense non-aqueous liquids (DNAPL). Being heavier than water and immiscible, DNAPls are particularly problematic because they can spread vertically into the aquifer, generating extensive dissolved groundwater plumes. In Figure 1, CVOCs in DNAPL form are shown in bold red, and the resulting dissolved groundwater plume is represented by the red halo emanating from the DNAPLs. One of the most significant lessons learned about chlorinated solvents is that their groundwater plumes can persist even when the source DNAPLs have been depleted. Plume persistence in the absence of source materials has been attributed to a phenomenon called matrix diffusion. Matrix diffusion can affect any type of dissolved contaminant, particularly when dissolved concentrations are high relative to regulatory standards. In addition to CVOCs, matrix diffusion can occur with other dissolved contaminants including radionuclides, per- and polyfluoroalkyl substances (PFAS), dissolved petroleum hydrocarbons such as benzene, toluene, ethylbenzene, and xylene (BTEX), and with solvent stabilizers such as 1,4-dioxane.
The life cycle of a matrix diffusion site is separated into two periods. In the loading period, the low-permeability (low K) zones act as storage areas for the contaminant mass. Following clean-up actions in the transmissive (high K) zones, the concentration gradient is reversed. The unloading period begins when the contaminant mass previously stored in the low-permeability zones diffuses back out into the transmissive zones. In Figure 1, the blue arrows represent the forward and backward diffusion gradients into the surrounding materials. Because the pace of back diffusion can be significantly slower than the loading of the contaminant, the plume resulting from the back diffusing mass can last for decades to centuries[2][3].
Given the prevalence and persistence of back diffusion plumes, modeling tools are needed that can accurately capture the dynamic progression of the contamination in both loading and unloading periods.
Matrix Diffusion Modeling Options
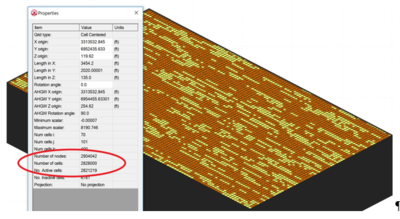
There are limited options available for simulating matrix diffusion effects at groundwater contamination sites. Available analytical models require simplifications that may overlook the unique complexities at actual remediation sites. Numerical models are often used to simulate solute transport, but require fine discretization to capture matrix diffusion concentration gradients, which occur at millimeters to centimeters scale. This very fine discretization (fine model grid) greatly increases the number of model cells required to simulate transport at field sites, greatly increasing computer model run times. Figure 2 shows a typical fine grid model containing almost 3 million gridblocks (cells). Models with large numbers of cells greatly increases model run times.
Dual-porosity models are another type of numerical model that is more computationally efficient because it uses a first order approximation to describe the mass transfer between the high K and low K zones. Dual-porosity models can be calibrated to match the effects of matrix diffusion on contaminant concentrations during early times. However, the first order mass transfer coefficient is time-dependent[4], so models calibrated to early time data will not accurately simulate concentrations at a later time. The REMChlor-MD model was developed under ESTCP project ER-201426 to provide a practical alternative to traditional approaches for modeling matrix diffusion.
REMChlor-MD’s Modeling Approach
REMChlor-MD employees a semi-analytical method adapted from the heat conduction problem in petroleum engineering to the problem of chemical diffusion with first order decay[5][6]. This semi-analytical method employees a fitting function to describe the concentration of the chemical in the low K zones in or adjacent to each gridblock:
- Equation 1: Cl(zl,t) = (Ct + Δt + pzl + qzl2) e-zl / d
| where: | |
| Cl | represents the concentration in the low K material; |
| Ct + Δt | is the concentration in the high K zone during the next numerical time-step; |
| zl | is the distance into the low K zone from the high K / low K interface; |
| p and q | are fitting parameters that can be solved for by enforcing the diffusion differential equation at the interface and mass conservation in the matrix gridblock; and |
| d | is the concentration penetration depth, which is defined in the REMChlor-MD User’s Manual in Appendix 1. |
Using the trial function, the diffusive mass flux can be computed analytically, which is the key time-saving component of the method. The only variable that requires numerical simulation is the concentration in the high-permeability parts of the aquifer.
There are three key geometrical model inputs to the semi-analytical method that can be used to model the diffusion process:
- Vf is the volume fraction of the high-permeability materials in a gridblock.
- Amd is the interfacial area between the high-K and low-K materials in a gridblock.
- L is the characteristic maximum diffusion length.
References
- ^ Falta, R.W., 2008. Methodology for comparing source and plume remediation alternatives. Groundwater, 46(2), pp.272-285. doi: 10.1111/j.1745-6584.2007.00416.x
- ^ Chapman, S.W. and Parker, B.L., 2005. Plume persistence due to aquitard back diffusion following dense nonaqueous phase liquid source removal or isolation. Water Resources Research, 41(12). doi: 10.1029/2005WR004224
- ^ Parker, B.L., Chapman, S.W. and Guilbeault, M.A., 2008. Plume persistence caused by back diffusion from thin clay layers in a sand aquifer following TCE source-zone hydraulic isolation. Journal of Contaminant Hydrology, 102(1-2), pp.86-104. doi: 10.1016/j.jconhyd.2008.07.003
- ^ Guan, J., Molz, F.J., Zhou, Q., Liu, H.H. and Zheng, C., 2008. Behavior of the mass transfer coefficient during the MADE‐2 experiment: New insights. Water Resources Research, 44(2). doi: 10.1029/2007WR006120
- ^ Vinsome, P.K.W. and Westerveld, J., 1980. A simple method for predicting cap and base rock heat losses in'thermal reservoir simulators. Journal of Canadian Petroleum Technology, 19(03). Pp 87-90 doi: 10.2118/80-03-04
- ^ Falta, R.W. and Wang, W., 2017. A semi-analytical method for simulating matrix diffusion in numerical transport models. Journal of contaminant hydrology, 197, pp.39-49. doi: 10.1016/j.jconhyd.2016.12.007

