File:McCall Article 3 Figure 3.PNG
No higher resolution available.
McCall_Article_3_Figure_3.PNG (463 × 508 pixels, file size: 93 KB, MIME type: image/png)
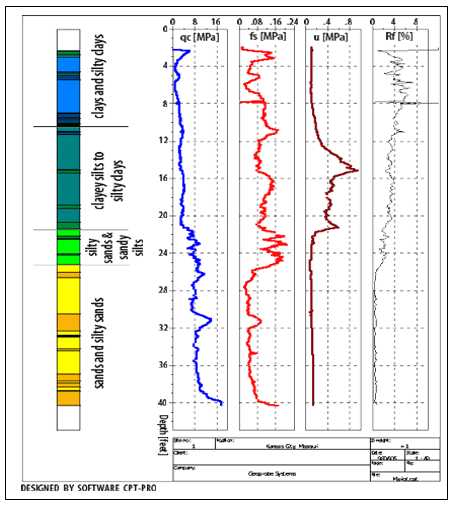
Figure 3: A CPTu log displaying l to r: lithologic graph based on log interpretation, tip resistance, sleeve friction, pore pressure and friction ratio.
File history
Click on a date/time to view the file as it appeared at that time.
| Date/Time | Thumbnail | Dimensions | User | Comment | |
|---|---|---|---|---|---|
| current | 21:12, 26 August 2016 | | 463 × 508 (93 KB) | Debra Tabron (talk | contribs) | Figure 3: A CPTu log displaying l to r: lithologic graph based on log interpretation, tip resistance, sleeve friction, pore pressure and friction ratio. |
- You cannot overwrite this file.
File usage
The following page links to this file: