File:Taylor-A1-Figure 9.PNG
No higher resolution available.
Taylor-A1-Figure_9.PNG (673 × 429 pixels, file size: 179 KB, MIME type: image/png)
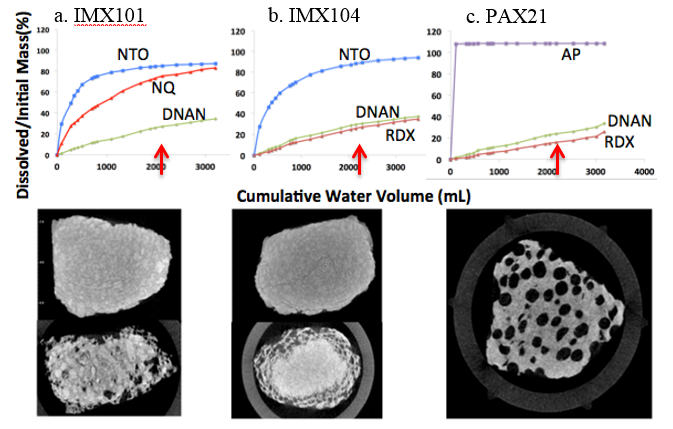
Figure 9. Dissolved mass versus precipitation volume for averaged data from: (a) five IMX101; (b) five IMX104; and (c) two PAX21 chunks placed outside to weather and dissolve. The constituents are NTO (blue), NQ (red), DNAN (green), RDX (orange), and AP (purple). Below are micro computed tomography images of one of the chunks taken at the beginning and part way through the tests (red arrows). The beginning PAX21 image was of poor quality due to the bright AP crystals it contained and is not shown.
File history
Click on a date/time to view the file as it appeared at that time.
| Date/Time | Thumbnail | Dimensions | User | Comment | |
|---|---|---|---|---|---|
| current | 19:13, 17 October 2016 | | 673 × 429 (179 KB) | Debra Tabron (talk | contribs) | Figure 9. Dissolved mass versus precipitation volume for averaged data from: (a) five IMX101; (b) five IMX104; and (c) two PAX21 chunks placed outside to weather and dissolve. The constituents are NTO (blue), NQ (red), DNAN (green), RDX (orange), and A... |
- You cannot overwrite this file.
File usage
The following page links to this file: